
Capital flows to Emerging Markets (EM) have picked up in 2019, as we expected in May. The main driver was a dovish pivot by the US Federal Reserve (Fed), which shifted from expectations of continued interest rate hikes at the start of the year to delivering three interest rate cuts by the end of 2019.
The Institute of International Finance (IIF) compile trackers of portfolio capital flows, which cover non-resident purchases of stocks and bonds in a sample of major EM. The trackers are a good indicator for the portfolio flows component of the official Balance of Payment (BoP) data, which are released much later.
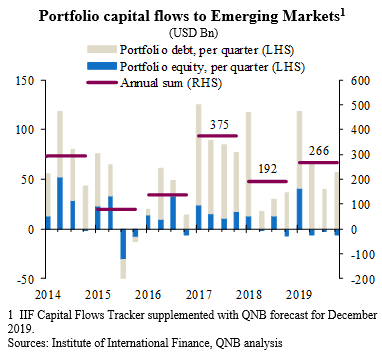
Sources: Institute of International Finance, QNB analysis
The IIF use their trackers of portfolio capital flows to inform their projections of non-resident capital flows to EM. In their October outlook, the IIF forecast a modest pickup of non-resident capital flows to EM from USD 1.1 trillion in 2018 and 2019 to USD 1.2 trillion in 2020. They worry that years of low interest rates and quantitative easing by major central banks have left global investors with portfolios that already have a large share allocated to EM, leaving little room for increased purchases of EM assets.
In this article we will review the main drivers of portfolio capital flows to EM in 2018 and 2019, before taking a look forward to 2020 (see chart).
In 2018, global financial conditions tightened and the USD appreciated amidst rising political risks and much weaker economic performance in the Euro area and Asia. According the IIF Tracker, portfolio capital flows to EM fell from USD 375 Bn in 2017 to USD 192 Bn per in 2018 (see chart). Even China, a key part of the 2017 EM rebound, started to decelerate as domestic policies were less supportive and trade jitters with the US began to dent business and consumer confidence.
2019 saw a rebound in portfolio capital flows to EM to an estimated USD 274 Bn (see chart). The main tailwind for the recovery was a dovish pivot by the Fed. However, the US-China trade war acted as a headwind for much of the year, with investor confidence undermined by repeated delays and disappointments in negotiations. Negotiations seemed to be heading for a deal in April, but then fell apart over the summer. Later in the year, progress towards a “Phase 1” deal was first announced by President Trump in October, and confirmed by both sides with further details in mid-December.
The proportion of capital flows that are heading to Emerging Asia is estimated at around 67% in 2019, down from 70% of flows in 2018, but still a greater than the 54% share in 2017. In contrast, the proportion of capital flows that are heading to the Middle East and Africa is estimated at around 6% in 2019, up from only 3% in 2018, but below the share of 12% in 2017.
Looking forward to 2020, we see three main drivers of a further pickup in portfolio capital flows to EM. First, global financial conditions remaining supportive of both capital flows to EM. Major central banks will keep interest rates low, which provides EM central banks with policy space to also keep interest rates low and support GDP growth. Second, at 4.6% GDP growth in EM is expected to be considerably stronger in 2020 than growth in advanced economies, which are only expected to grow by 1.5%. Third, although it is far from comprehensive, the “Phase 1” deal between the US and China is a step in the right direction towards de-escalation of the trade war, which will support both global and EM GDP growth.
Like in May, we still expect non-resident capital flows to EM to pick up more strongly than the IIF for two main reasons. First, our view on global GDP growth is more optimistic than the IIF’s. Second, we believe that higher GDP growth will allow EM economies to continue to supply investors with assets offering attractive risk-adjusted returns.
Download the PDF version of this weekly commentary in English or عربي